-
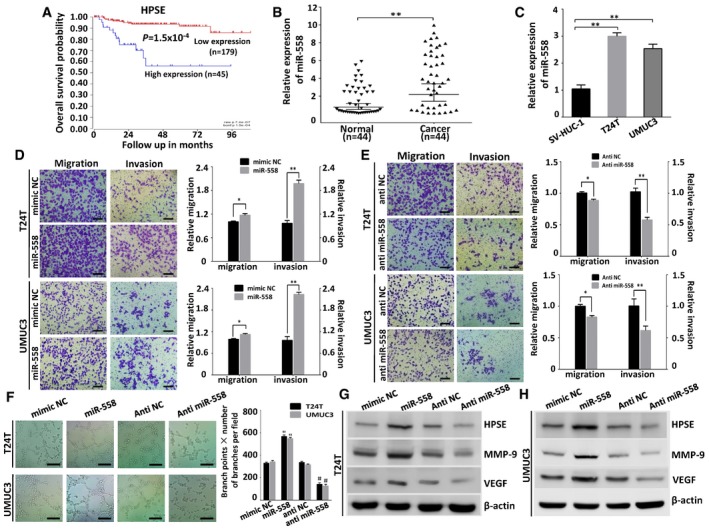
A
Kaplan–Meier survival plots of 224 well‐defined bladder cancer cases derived from R2 microarray analysis and visualization platform (
http://r2.amc.nl) showing the survival probability of patients with high or low expression of HPSE.
-
B, C
Real‐time PCR revealed that miR‐558 was up‐regulated in bladder cancer tissues (n = 44) and cell lines (T24T, UMUC3), compared with normal adjacent non‐tumorous bladder tissues (n = 44) or SV‐HUC‐1 cells, respectively. Data are mean ± SEM, n = 3. **P < 0.01 (Student's t‐test).
-
D, E
Transwell migration and matrigel invasion assays indicating the increased migration and invasion capabilities in T24T and UMUC3 cells transfected with miR‐558 mimics. In contrast, the transfection of anti‐miR‐558 inhibited the migration and invasion of bladder cancer cells. Data are mean ± SEM, n = 3. *P < 0.05, **P < 0.01 (Student's t‐test). Scale bar, 100 μm.
-
F
The tube formation of HUVEC cells was promoted by treatment with the preconditioned medium of T24T and UMUC3 cells transfected with miR‐558 mimics; however, knockdown miR‐558 inhibited the tube formation ability of HUVEC cells. Data are mean ± SEM, n = 3. **P < 0.01 versus mimic NC; ##
P < 0.01 versus anti‐NC (Student's t‐test). Scale bar, 100 μm.
-
G, H
Western blot indicating that miR‐558 up‐regulated the expression of HPSE, MMP‐9, and VEGF in T24T and UMUC3 cells, while anti‐miR‐558 down‐regulated the expression of HPSE, MMP‐9, and VEGF.