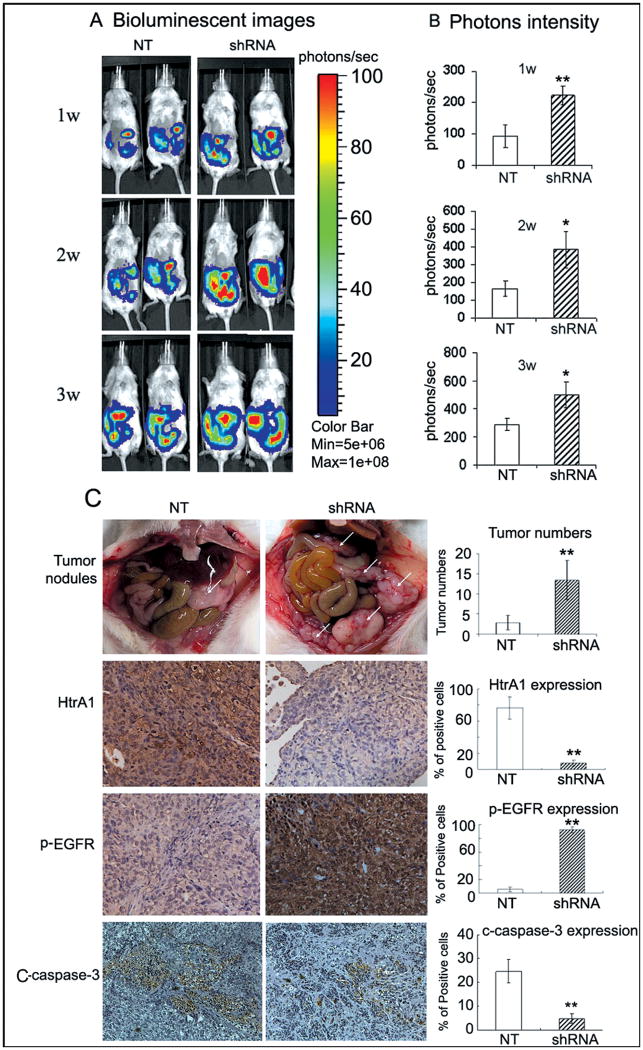
Figure 6.
Down-regulation of HtrA1 promotes peritoneal dissemination of ovarian cancer cells. A, bioluminescent images in mice. 2.5×10⁶ of SKOV3ip-luc cells with NT or HtrA1 shRNA were injected i.p. into the NOD-SCID mice. Abdominal colonization was measured using bioluminescence at 1, 2, and 3 weeks post injection. B, bar Graph showing photon intensity. C, pathological characteristics of dissemination in HtrA1 knock-down xenografts. Significantly higher numbers of tumor nodules were observed in mice from shRNA group compared to those from NT group as indicated by white arrows. Bar graph shows the average number of tumor nodules per mouse. Expression of HtrA1, p-EGFR, and C-capase-3 in tumor sections were analyzed with immunohistochemistry, photographed at ×200magnification. Schematic representation shows the quantified expression level of HtrA1 and p-EGFR. Data are expressed as mean±s.d. *, P < 0.05, **, P < 0.01

