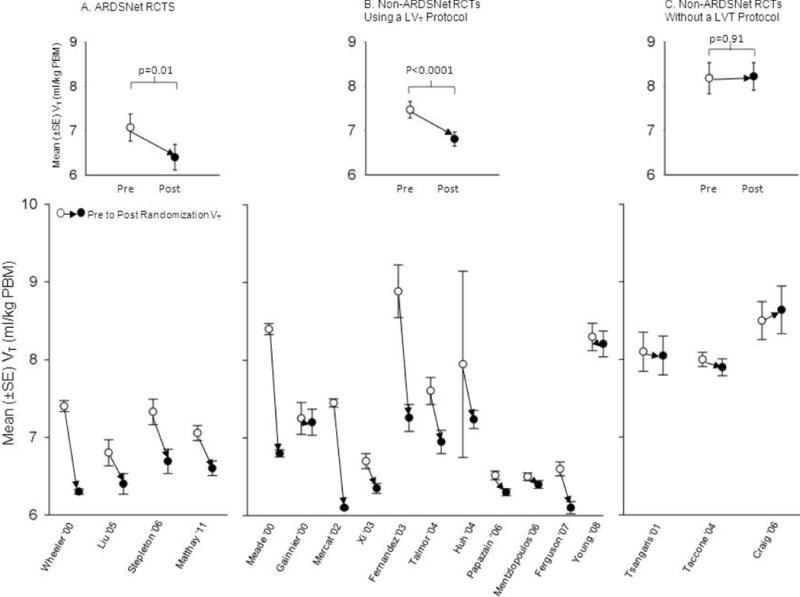
Figure 3.

This figure compares mean tidal volumes (VT, ±SE) pre-randomization (open circles) and post-randomization (closed circles) in RCTs at ARDSNet centers (Figure 3A) and at non-ARDSNet centers that either did (Figure 3B) or did not (Figure 3C) stipulate the use of a low VT protocol for patients after randomization. The figures in the insets in each panel show the estimated mean pre- and post-randomization VT in each group of trials with p-values reflecting the significance for the change in VT.
