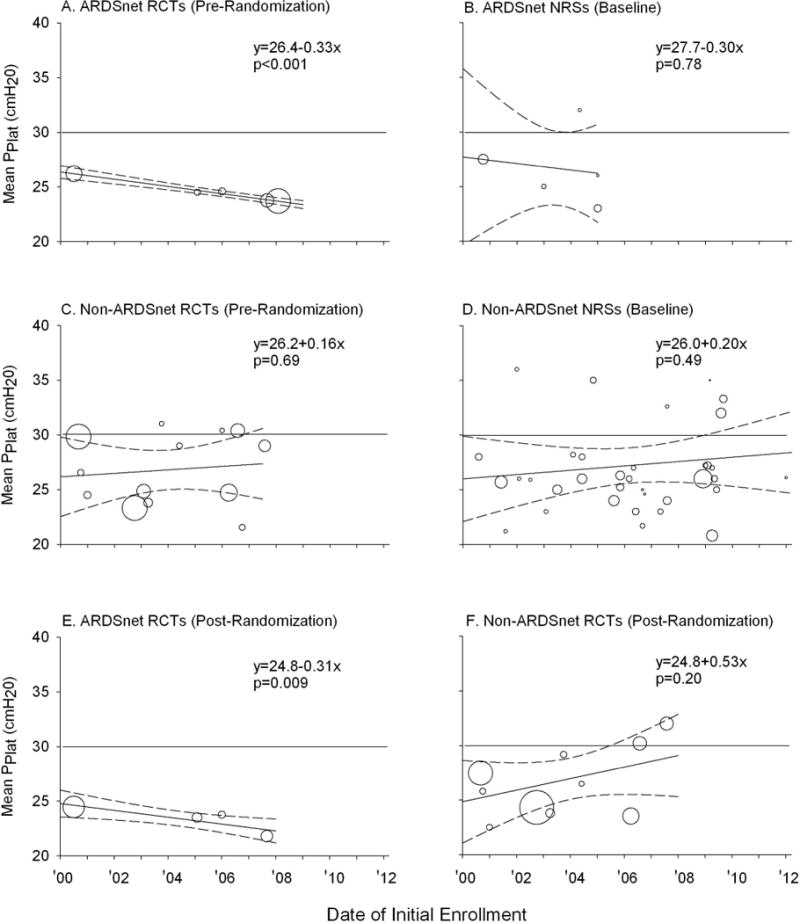
Figure 4.

Mean plateau pressure (PPlat) for the various types of centers and trials are shown. The area of each circle is proportional to the inverse of the variance associated with each mean PPlat value. The solid diagonal line in each panel represents the weighted regression line and the dashed lines represent the 95% CIs for the relationship between baseline PPlat and the year of the start of enrollment for each group of trials. Equations for the weighted regression lines and p-values for the slope of the line are shown. These equations were available for all groups of studies except for nonrandomized studies at ARDSNet centers (Panel B) in which there were too few studies to fit a regression line. A horizontal line denoting a PPlat of 30 cmH2O is included for reference. Panels E and F show data post-randomization PPlat in RCTs employing low VT protocols.
