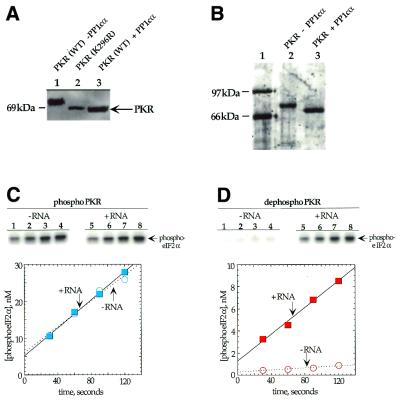
Figure 2.
Dephosphorylation of PKR by PP1cα. (A) Anti-FLAG western blot of a SDS–PAGE gel used to resolve PKR samples. Lane 1, wild-type FLAG epitope-tagged PKR overexpressed in E.coli; lane 2, FLAG epitope-tagged kinase-deficient K296R mutant of PKR overexpressed in E.coli; lane 3, wild-type FLAG epitope-tagged PKR overexpressed in E.coli and treated with PP1cα. (B) SyproOrange stained gel used to resolve phosphorylated and dephosphorylated PKR samples after purification. Lane 1, protein molecular weight markers; lane 2, wild-type FLAG epitope-tagged PKR overexpressed in E.coli; lane 3, wild-type FLAG epitope-tagged PKR overexpressed in E.coli and treated with PP1cα. (C) Time course for the phosphorylation of eIF2α by PKR samples. (Top) Storage phosphor autoradiograms of SDS–PAGE gels used to resolve products from kinase reactions with phosphorylated PKR. Lanes 1–4, no RNA added; lanes 5–8, poly(I)·poly(C) added to a final concentration of 1 µg/ml. Lanes 1 and 5, 30 s time points; lanes 2 and 6, 60 s time points; lanes 3 and 7, 90 s time points; lanes 4 and 8, 120 s time points. (Bottom) Plot of product formation as a function of time in the presence (blue colored boxes) and absence (blue open circles) of 1 µg/ml poly(I)·poly(C). The data were fitted to a line using the least squares method of KaleidaGraph. Data points reported are the average of three independent experiments. (D) (Top) Storage phosphor autoradiograms of SDS–PAGE gels used to resolve products from kinase reactions with PP1cα-treated PKR. Lanes 1–4, no RNA added; lanes 5–8, poly(I)·poly(C) added to a final concentration of 1 µg/ml. Lanes 1 and 5, 30 s time points; lanes 2 and 6, 60 s time points; lanes 3 and 7, 90 s time points; lanes 4 and 8, 120 s time points. (Bottom) Plot of product formation as a function of time in the presence (red filled boxes) and absence (red open circles) of 1 µg/ml poly(I)·poly(C).

