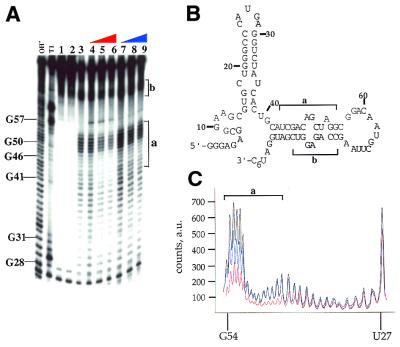
Figure 4.
MPE·Fe footprinting of a 92 nt activator RNA of PKR using phosphorylated and dephosphorylated forms of the enzyme. (A) Storage phosphor autoradiogram of a polyacrylamide gel showing the effect of dephosphorylated and phosphorylated PKR on MPE·Fe cleavage. OH–, alkaline hydrolysis; T1, T1 RNase; lane 1, RNA with no added MPE·Fe or Na ascorbate; lane 2, RNA in the presence of 500 nM MPE·Fe with no added Na ascorbate; lane 3, RNA in the presence of 500 nM MPE·Fe and 20 mM Na ascorbate; lanes 4–6, RNA in the presence of 500 nM MPE·Fe and 20 mM Na ascorbate and increasing concentrations of dephosphoPKR (lane 4, 10 nM; lane 5, 100 nM; lane 6, 330 nM); lanes 7–9, RNA in the presence of 500 nM MPE·Fe and 20 mM Na ascorbate and increasing concentrations of phosphoPKR (lane 7, 10 nM; lane 8, 100 nM; lane 9, 330 nM). The mapping of the major cleavage sites by MPE·Fe (identified by letters and brackets) is shown on the gel. Protection from cleavage at this site by increasing concentrations of dephosphoPKR was reproducible in five independent determinations with a representative gel shown. (B) Sites of protection from MPE·Fe cleavage are identified on the predicted secondary structure of the 92 nt activator RNA as letters and brackets. (C) Quantification of the cleavage intensities in the presence of no protein (black line), phosphoPKR at 330 nM (blue line), dephosphoPKR at 330 nM (red line). The nucleotide positions are denoted on the x-axis of the graph. The y-axis represents counts on the phosphor plate as arbitrary units (a.u.).

