Figure 1.
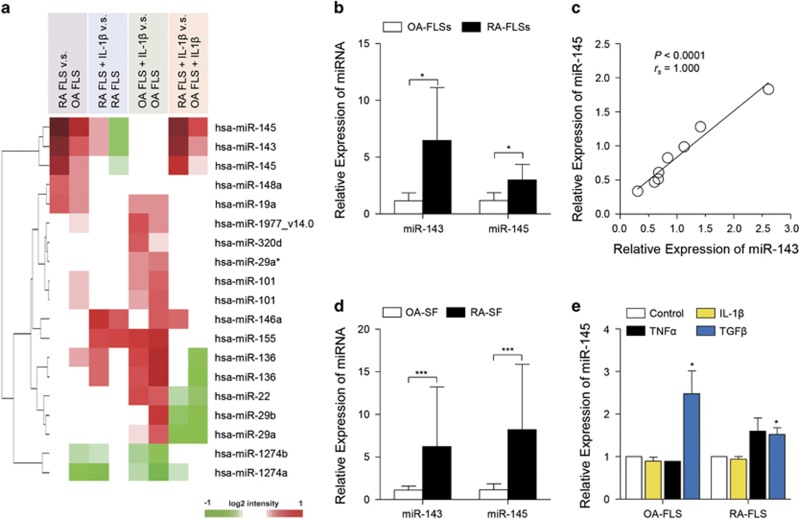
microRNA profiling in RA-FLSs. (a) Heatmap of microarray data showing DEmiRs among RA-FLSs versus OA-FLSs, RA-FLSs with IL-1β versus RA-FLSs, OA-FLSs with IL-1β versus OA-FLSs and RA-FLSs with IL-1β versus OA-FLSs with IL-1β. Red and green denote high and low expression of DEmiRs, respectively; red and green denote high and low expression of DEGs, respectively. (b) Higher levels of miR-143 and miR-145 in RA-FLSs (n=5) than in OA-FLSs (n=5) as determined by quantitative real-time PCR; 5.6-fold, P=0.031 for miR-143; 2.6-fold, P=0.028 for miR-145. RUN6B_2 small nuclear RNA (snRNA) was used as an internal control. (c) Spearman correlation of relative expression of miR-143 and miR-145 in RA-FLSs (n=8). (d) miR-143 and miR-145 levels in synovial fluids obtained from RA patients (RA-SF, n=4) and OA patients (OA-SF, n=5) as determined by real-time PCR. (e) Increase in miR-145 expression in FLSs by TGFβ stimulation. The OA-FLSs (n=4) and RA-FLSs (n=4) were treated with IL-1β (1 ng ml−1), TNFα (10 ng ml−1) and TGFβ (10 ng ml−1) for 48 h, and miR-145 expression was then determined by real-time PCR. The data show the mean±s.d. *P<0.05 and ***P<0.001.

