Figure 2.
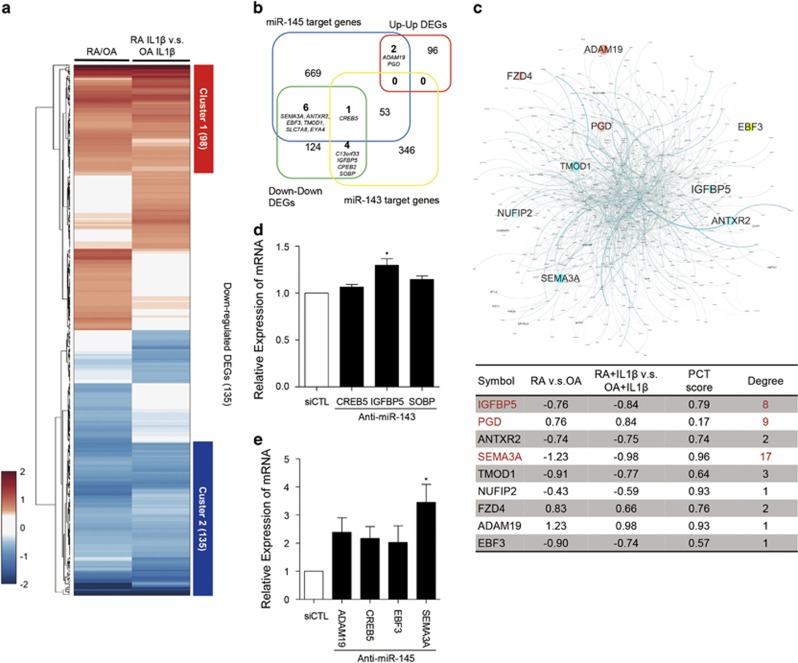
miR-143/145-target prediction and network model of the predicted targets in RA-FLSs. (a) Heatmap of 470 DEGs up- or downregulated in RA-FLSs irrespective of IL-1β stimulation. Compared profile sets were as follows: RA-FLSs versus OA-FLSs; RA-FLSs with IL-1β versus OA-FLSs with IL-1β RA-FLSs with IL-1β versus RA-FLSs; OA-FLSs with IL-1β versus OA-FLSs. Cluster 1 is a group of 98 DEGs that was upregulated in RA-FLSs and Cluster 2 represents 135 DEGs that were downregulated. The numbers in parenthesis refer to the number of included DEGs in each cluster. Red and blue denote high and low expression of DEGs, respectively (b) Venn diagram showing the relationship between two sets of predicted target genes for miR-143 and miR-145 and two DEG cluster sets of RA-FLSs versus OA-FLSs. The numbers of included genes are represented. (c) Network model of predicted target genes for miR-143 and miR-145 (miR-143: 404 genes, miR-145: 731 genes, shared: 54 genes, and total: 1081 genes). Node color refers to fold change of RA-FLSs versus OA-FLSs (red=up, cyan=down). Node size refers to -log10P of RA-FLSs versus OA-FLSs. Edge thickness indicates edge betweenness (upper panel). The table in the lower panel shows the fold change, probability of conserved targeting (PCT) score, and the degree of interactions of potential target gene candidates in the network model. (d, e) Relative expression of six selected target DEGs in RA-FLSs transfected with miR-143 siRNA (d) or miR-145 siRNA (e), as determined by real-time PCR. GAPDH mRNA was used as an internal control. The data show the mean±s.d. *P<0.05.

