Figure 2.
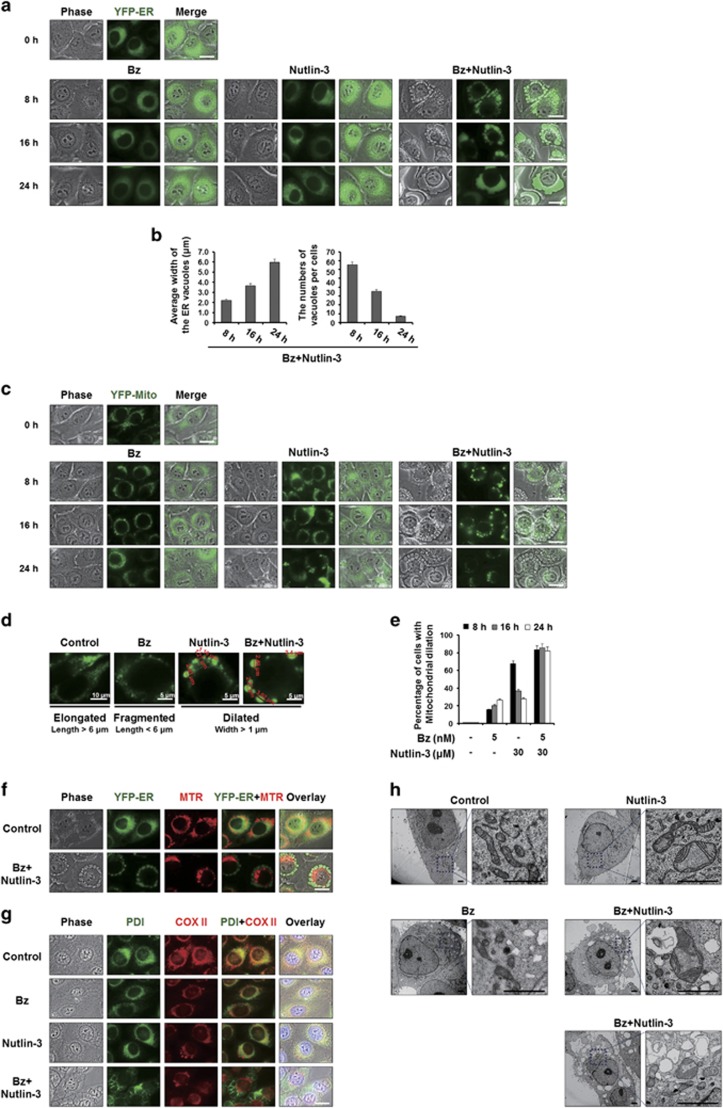
Vacuolation induced by bortezomib/nutlin-3 is derived from the dilation of both the ER and mitochondria. (a, c) YFP-ER/435S cells expressing the fluorescence selectively in the ER (a) or YFP-Mito/435S cells expressing the fluorescence selectively in mitochondria (c), were treated with 5 nM bortezomib and/or 30 μM nutlin-3 for the indicated time points and observed under the fluorescent and phase-contrast microscope. Scale bars, 20 μm. (b) The average widths of the vacuoles originated from the ER and the numbers of the vacuoles per cells were measured in YFP-ER cells treated with bortezomib and/or nutlin-3 for the indicated time points using AxioVision Rel. 4.8 software (Zeiss). (d) Mitochondrial morphology of ‘elongated’, ‘fragmented’ and ‘dilated’ was defined as the mitochondria with the length longer than 6 μm, those with shorter than 6 μm, and those with widths longer than 1 μm. Representative mitochondrial morphologies of YFP-Mito/435S cells treated as indicated are shown. (e) YFP-Mito/435S cells with mitochondrial dilation were quantified following treatment with 5 nM bortezomib and/or 30 μM nutlin-3 for the indicated time points. (f) YFP-ER/435S cells treated with 5 nM bortezomib and 30 μM nutlin-3 for 8 h were stained with 100 nM MitoTracker-Red (MTR) and observed under the phase-contrast and fluorescence microscope. Scale bar, 20 μm. (g) MDA-MB 435S cells were treated with 5 nM bortezomib and/or 30 μM nutlin-3 for 16 h, fixed, and subjected to the immunocytochemistry of PDI and COX II. Scale bar, 20 μm. (h) MDA-MB 435S cells were treated with 5 nM bortezomib and/or 30 μM nutlin-3 for 8 h, fixed, and subjected to electron microscopy. Scale bars, 0.5 μm.

