Figure 5.
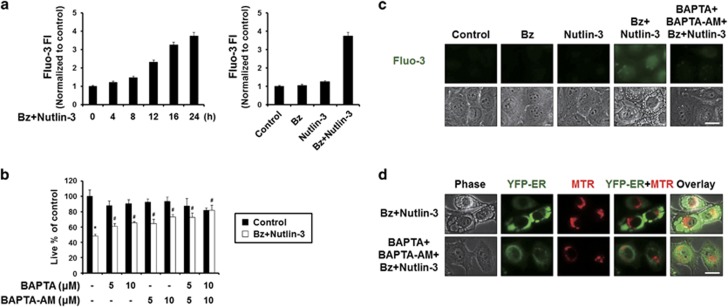
Disruption of intracellular Ca2+ homeostasis critically contributes to the dilation of the ER and subsequent cell death by bortezomib/nultin-3. (a) MDA-MB 435S cells treated with 5 nM bortezomib plus 30 μM nutlin-3 for the indicated time points were subjected to flow cytometry using 1 μM Fluo-3 and changes in Ca2+ levels were compared among the treatment groups. (b) MDA-MB 435S cells were pretreated with BAPTA, BAPTA-AM or BAPTA plus BAPTA-AM at the indicated concentrations and further treated with 5 nM bortezomib plus 30 μM nutlin-3 for 24 h. Cell viability was measured using calcein-AM and EthD-1. Data represent the means±s.d. One-way ANOVA and Bonferroni’s post hoc test. *P<0.005 vs untreated cells, #P<0.005 vs bortezomib/nutlin-3-treated group. The experiment was repeated at least three times with similar results. (c) MDA-MB 435S cells were pretreated with 10 μM BAPTA, 10 μM BAPTA-AM or 10 μM BAPTA plus 10 μM BAPTA-AM and further treated with 5 nM bortezomib plus 30 μM nutlin-3 for 16 h. Treated cells were stained with 1 μM Fluo-3 and observed under the phase-contrast and fluorescence microscope. Scale bar, 20 μm. (d) YFP-ER/435S cells were pretreated with 10 μM BAPTA plus 10 μM BAPTA-AM and further treated with 5 nM bortezomib plus 30 μM nutlin-3 for 16 h. Treated cells were stained with 100 nM MTR and observed under phase-contrast and the fluorescence microscope. Scale bar, 20 μm.

