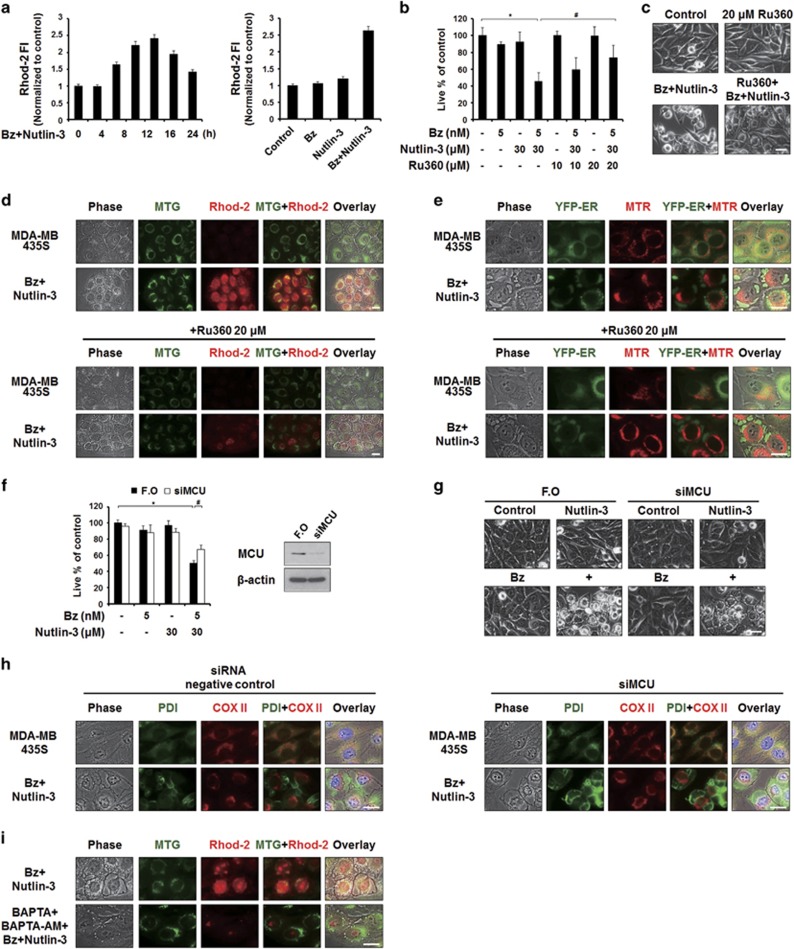
Figure 6.
MCU-mediated mitochondrial Ca2+ overload is important for the cell death but not for vacuolation induced by bortezomib/nutlin-3. (a) MDA-MB 435S cells treated with 5 nM bortezomib and 30 μM nutlin-3 for the indicated time points were stained with 1 μM Rhod-2 and processed for FACS analysis. Rhod-2 fluorescence intensities (FI) in cells treated with 5 nM bortezomib plus 30 μM nutlin-3 for the indicated time points were compared with those of untreated cells. (b) MDA-MB 435S cells were pretreated with or without Ru360 at the indicated concentrations and further treated with 5 nM bortezomib plus 30 μM nutlin-3 for 24 h. Cellular viability was assessed using calcein-AM and EthD-1. Data represent the means±s.d. Kruskal–Wallis test was performed followed by Dunn’s test. *P<0.005 vs untreated cells, #P<0.005 vs cells treated with bortezomib/nultin-3. (c) MDA-MB 435S cells were untreated or treated with 5 nM bortezomib and 30 μM nutlin-3 in the absence or presence of 20 μM Ru360 for 24 h. Cells were observed under the phase-contrast microscope. Scale bar, 10 μm. (d, e) MDA-MB 435S cells (d) or YFP-ER/435S cells (e) were treated with 5 nM bortezomib and 30 μM nutlin-3 for 8 h in the absence or presence of Ru360. Treated cells were stained with 1 μM Rhod-2 and 100 nM MTG (d) or stained with 100 nM MTR (e) and observed under the phase-contrast and fluorescence microscope. Scale bars, 20 μm. (f, g) MDA-MB 435S cells were transfected with the fluorescent oligonucleotide (FO) or a MCU-targeting siRNA (siMCU) for 24 h and further treated with 5 nM bortezomib plus 30 μM nutlin-3 for 24 h. (f) Cell viability was assessed using calcein-AM and EthD-1. Data represent the means±s.d. Kruskal–Wallis test was performed followed by Dunn’s test. *P<0.005 vs cells transfected with FO, #P<0.005 vs cells transfected with FO and further treated with bortezomib/nutlin-3. Knockdown of MCU was confirmed by western blotting and β-actin was used as a loading control in western blots. (g) Transfected and treated cells were observed under the phase-contrast microscope. Scale bars, 10 μm. (h) Transfected cells were treated with 5 nM bortezomib plus 30 μM nutlin-3 for 16 h, fixed, and subjected for immunocytochemistry of COX II and PDI. Scale bars, 20 μm. (i) MDA-MB 435S cells were pretreated with or without 10 μM BAPTA plus 10 μM BAPTA-AM for 30 min and further treated with 5 nM bortezomib and 30 μM nutlin-3 for 16 h. Treated cells were stained with 1 μM Rhod-2 and 100 nM MTG and observed under the phase-contrast and fluorescence microscope. Scale bar, 20 μm.

