Figure 1.
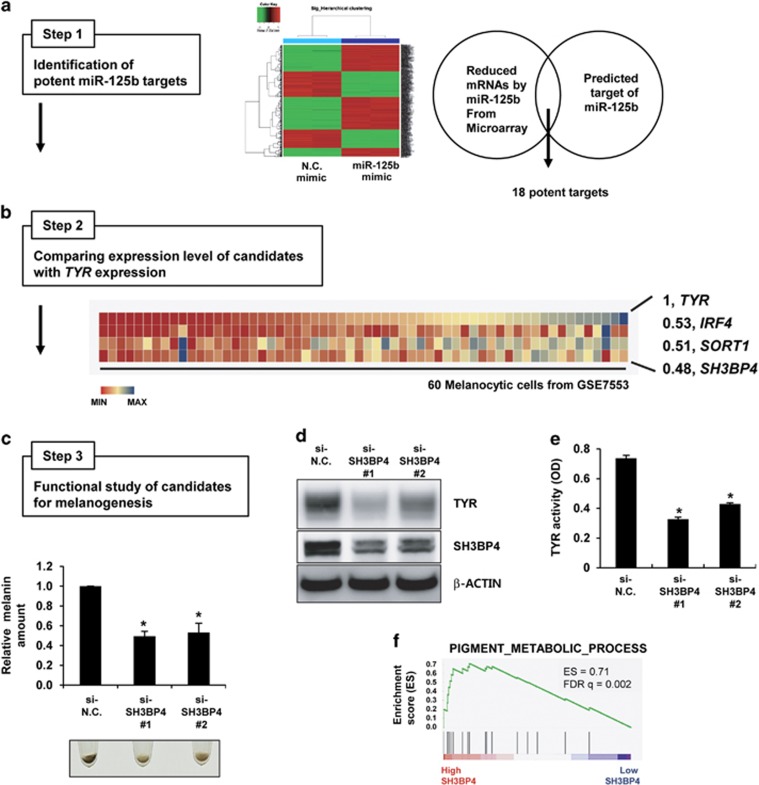
Identification of SH3BP4 as a pigmentation gene. (a) WM266-4 melanoma cells were transfected with negative control (N.C.) or miR-125b mimics and subjected to microarray analysis. Genes that were downregulated by miR-125b overexpression were analyzed. Putative miR-125b targets were predicted using miRNA target prediction algorithms. From the intersection of both analyses, 18 candidate targets of miR-125b were selected (Step 1). (b) The expression of each gene was compared with that of TYR in the data set for 60 melanocytic cell lines (GSE7553; Step 2). Heat maps for the expression of IRF4, SORT1 and SH3BP4, which were highly correlated with TYR, and Pearson’s correlation coefficients (r) are shown. (c) Human primary melanocytes were transfected with negative control (si-N.C.) or SH3BP4 (si-SH3BP4) siRNAs for 7 days. Representative images of cell pellets (2 × 10⁴ cells) are shown. The relative melanin content was determined. The data are presented as the mean±s.d. of three independent experiments. *P<0.05, unpaired Student’s t-tests. (d) Melanocytes were transfected with the indicated siRNAs for 3 days. Protein expression was analyzed by western blotting using anti-TYR or anti-SH3PB4 antibodies. β-Actin was used as a loading control. (e) In vitro TYR activity was measured by incubating cell extracts as described in the Materials and Methods. The data are presented as the mean±s.d. of three independent experiments. *P<0.05, unpaired Student’s t-tests. (f) GSEA plot for melanoma cells expressing high SH3BP4 versus low SH3BP4 levels. FDR, false-discovery rate; ES, enrichment score.

