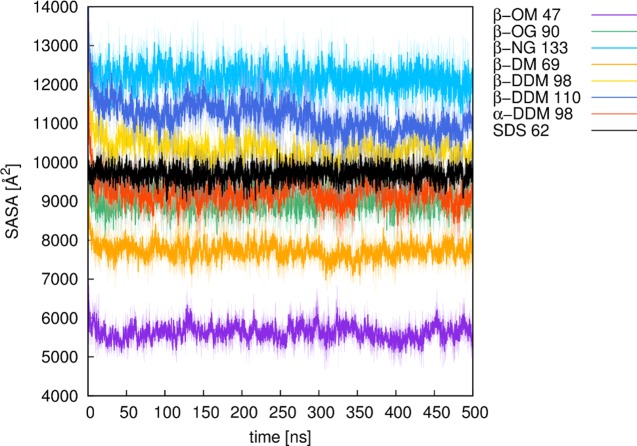
Figure 3.
Plots of the solvent accessible surface area (SASA) of different micelles over 500 ns of molecular dynamics simulation time. Numbers denote the number of lipid molecules of a micelle. All of the values are shown here as averages over three independent MD simulations (solid line), with the standard deviations over each frame of the three trajectories shown as the shaded background to each average value. For definitions of the lipid abbreviations used, see Table 1.

