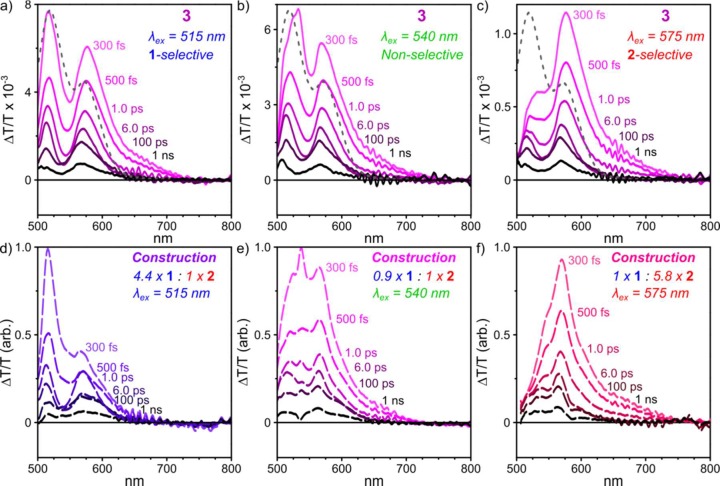
Figure 4.
Strong coupling in heteroleptic cages. TA spectra of 3 at selected pump–probe delays, following excitation at (a) 515 nm, (b) 540 nm, and (c) 575 nm. Dashed spectrum corresponds to UV–vis absorption. (d–f) Synthetic TA spectra constructed from homoleptic cage data, based on differing relative contributions to overall UV–vis absorption (ratio indicated). These constructed spectra fail to reproduce peak positions or relative intensities.

