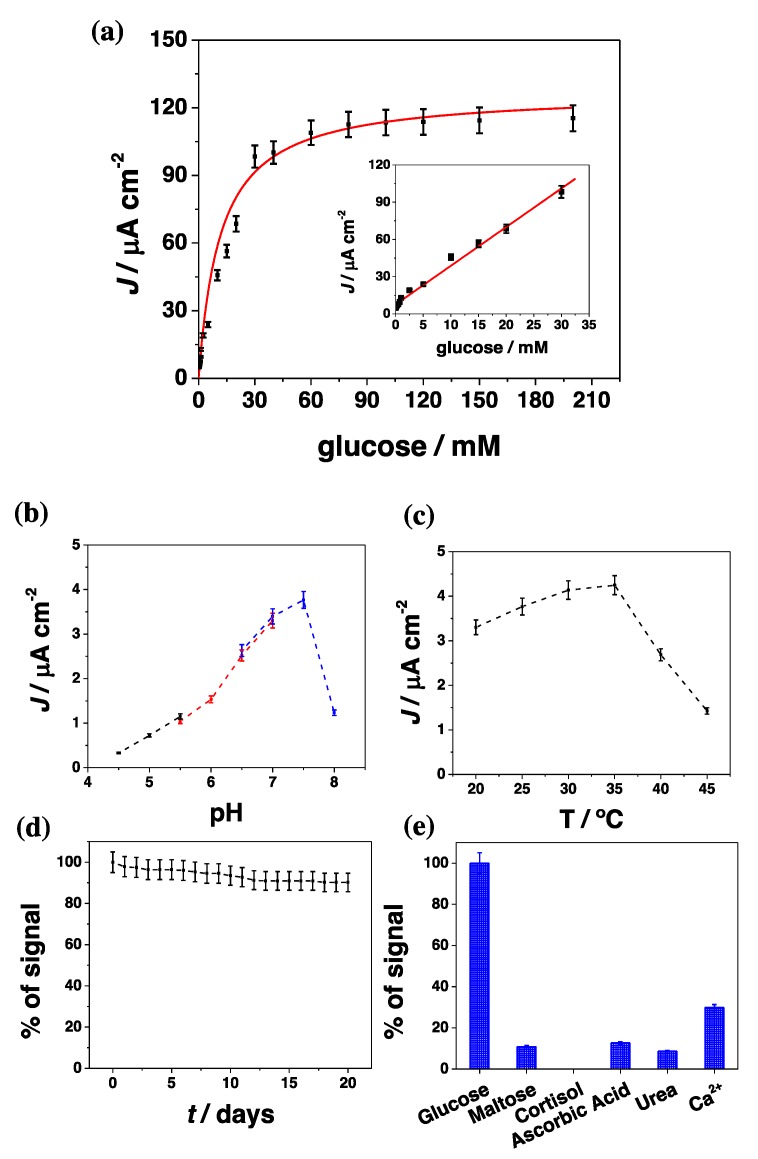
Figure 4.
(a) Glucose biosensor calibration graph of CtCDH C291Y/GA/4-APh,4-MBA/AuNPs/GC in 50 TRIS buffer pH 7.4 (0.1 M KCl); Eapp = 0.250 vs. Ag|AgClsat; flow rate 0.5 mL min−1; inset: linear part of the calibration curve; (b) biosensor response over the pH range (4.5–8): 50 mM acetate buffer (black), 50 mM MOPS buffer (red) and in 50 mM TRIS buffer (blue), with Eapp = 0.250 vs. Ag|AgClsat; flow rate 0.5 mL min−1; (c) biosensor response over the T range (20–45 °C) in TRIS buffer; (d) lifetime of CtCDH C291Y/GA/4-APh,4-MBA/AuNPs/GC biosensor in presence of 750 μM glucose solution; (e) influence of interfering compounds on glucose response in presence of 750 μM glucose, maltose, cortisol, ascorbic acid, Ca2+. Experimental conditions (c–e): 50 TRIS buffer pH 7.4 (0.1 M KCl), Eapp = 0.250 vs. Ag|AgClsat; flow rate 0.5 mL min−1; injection volume 50 μL; T = 25 °C.

