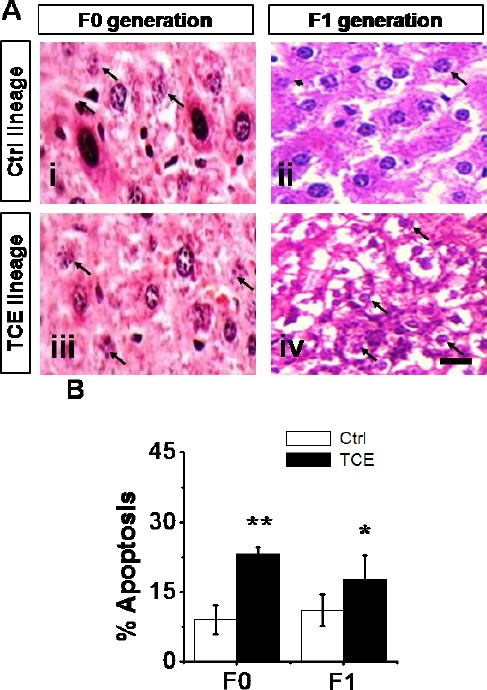
Fig. 5.

Hepatocellular apoptosis in Ctrl and TCE F0 and F1 generation. (A) Micrographs H&E–stained sections show hepatocellular apoptosis in F0 (panel iii) and F1 (panel iv) generation TCE population compared to F0 (panel i) and (panel ii) Ctrl population. Scale bar = 100 μm, 63X. (B) Percentages of hepatocellular apoptosis. Ctrl and TCE livers were examined with the mean ± SEM presented and asterisks (*) indicating a statistically significant difference (P ≤ 0.05) vs. TCE-treated mice. Student’s t-tests. *P ≤ 0.05, **P ≤ 0.01.
