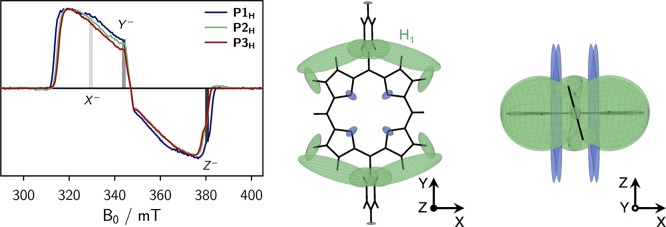
Figure 3.
Overlay of the transient cw EPR spectra of the singly linked compounds (left), and visualization of the calculated hyperfine coupling tensors and definition of the ZFS tensor axes in top view (center) and side view (right). Proton hyperfine tensors are shown in green, whereas nitrogen hyperfine tensors are depicted in blue. The field positions corresponding to the X–, Y– and Z– orientations are indicated in the spectra. A large hyperfine coupling exceeding −10 MHz is calculated for the proton in meso-position of the porphyrin core. This large coupling is omitted in the figure for clarity. The EPR data were acquired in frozen MTHF at 20 K.

