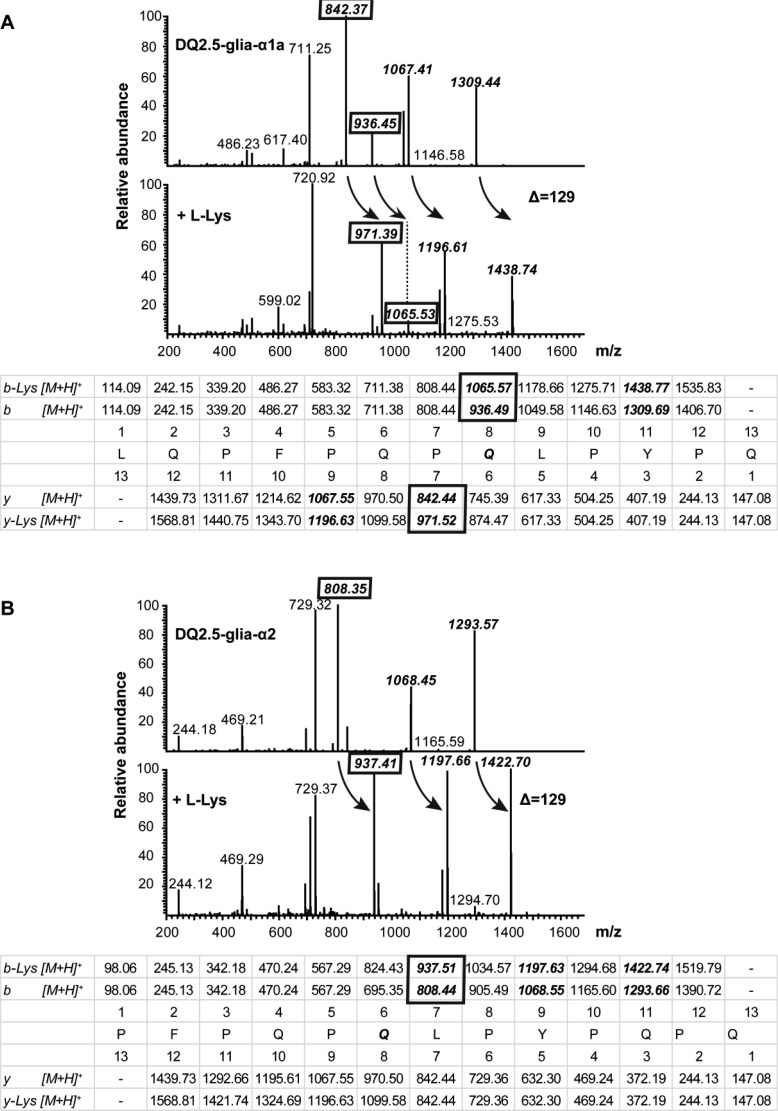
Figure 2.
Identification of transamidated sites induced by mTG using LTQ-FT Ultra. (A) Observed fragment of DQ2.5-glia-α1a before treatment (upper spectrum) and after treatment with mTG in the presence of Lys (lower spectrum); predicted fragment ion masses are given in the table with identified ions illustrating transamidation shown in boxes. (B) Observed fragment of DQ2.5-glia-α2 before treatment (upper spectrum) and after treatment with mTG in the presence of Lys (lower spectrum); predicted fragment ion masses are given in the table with identified ions illustrating transamidation shown in boxes. Arrows indicate the shift in Da due to transamidation.

