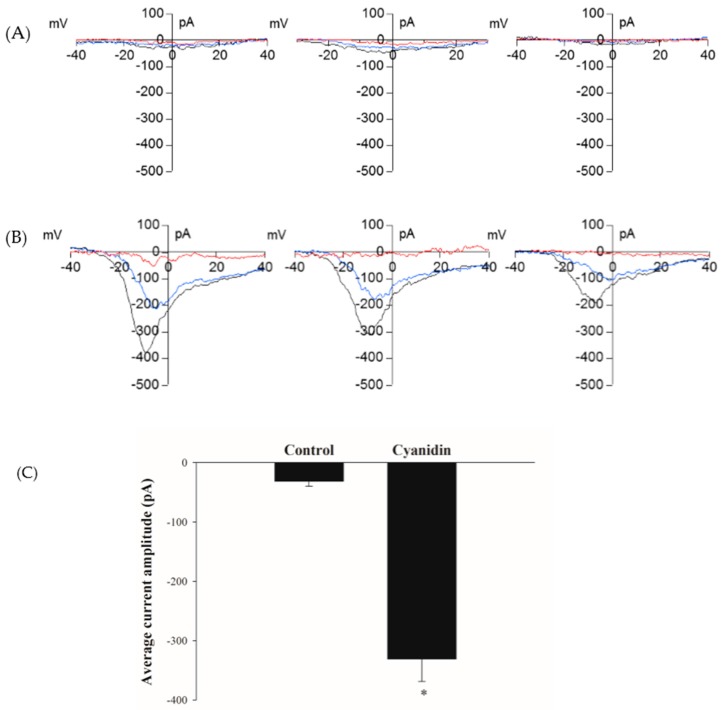
Figure 5.
Cyanidin activates voltage-dependent Ca2+ channels. (A) Representative current–voltage relationships (I/V) from single cells perfused with control DMSO; (B) Representative current–voltage relationships (I/V) from single cells perfused with 100 µM cyanidin. The red (at break-in), blue (during), and black (fully developed) lines represent the current development; (C) Average inward peak current amplitude from control and 100 µM cyanidin groups. Results are represented as mean – S.E.M. (n = 24–31 cells/group). * p < 0.05 when compared with the control.

