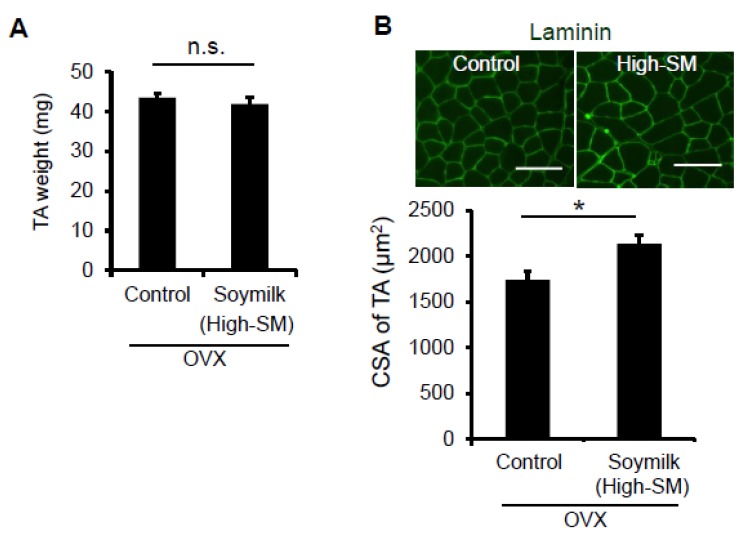
Figure 4.
Effect of High-SM intake on muscle in OVX mice. OVX mice were fed with High-SM as shown in Figure 3. (A) Muscle weight of TA was measured at 12 weeks followed by the start of soymilk intake. (B) Representative images of immunohistochemistry for laminin. CSA of TA muscle was shown (control, n = 6; soymilk, n = 6 mice). Data represent the mean ± SEM. n.s., not significant. An asterisk denotes a significant difference from control (* p < 0.05). Scale bar, 100 μm.

