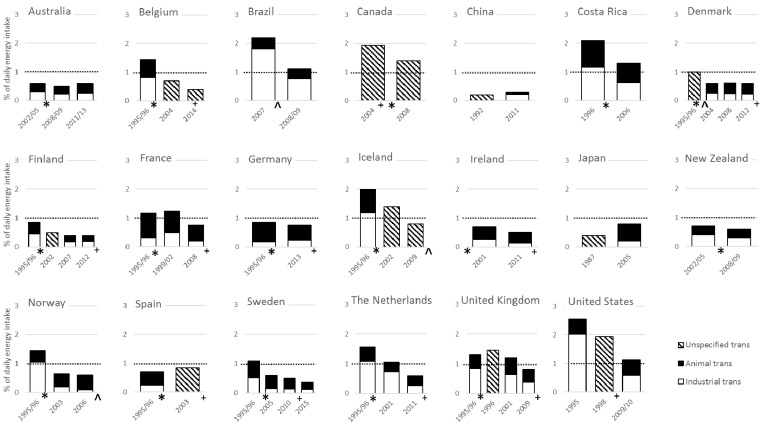
Figure 2.
Time trends of intakes of trans fat and its sources in populations from 20 countries. Data reported by year of food composition data. Symbols on the time-axis refer to the year of the introduction of voluntary reductions (*), mandatory labeling (+), or mandatory limits (^) to lower trans fat intake. The dotted lines represent the maximal recommended intake level of trans fat [6].

