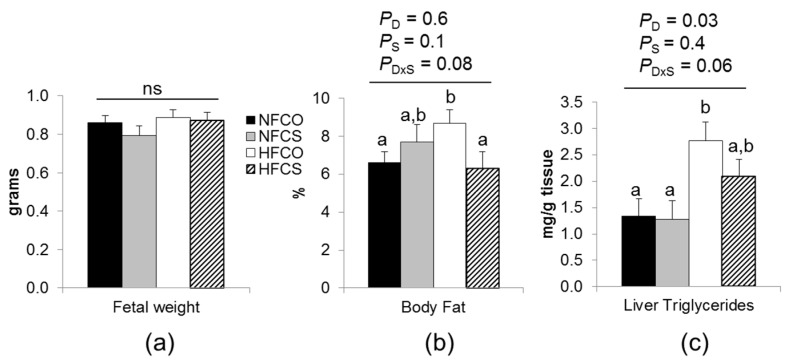
Figure 3.
Fetal weight and adiposity at E17.5. (a) Fetal weight; (b) percent total body fat of fetuses; (c) fetal liver triglyceride concentrations. Experimental diets were fed to dams from 6 weeks before timed-mating to gestational day 17.5. Data were analyzed using the general linear model. Posteriori analysis of variance (ANOVA) followed by posthoc Fisher‘s least significant difference (LSD) analysis between groups was conducted with pd×s ≤ 0.2. NFCO (solid bars): n = 9; NFCS (shaded bars): n = 6; HFCO (open bars): n = 7; HFCS (hatched bars): n = 6. n is the number of dams. Fetal weight was analyzed with pooled data of all fetuses in each dam (5–10/dam); body fat and liver triglyceride concentrations were analyzed with pooled data of two randomly selected fetuses in each dam. Values are mean ± standard error of mean (SEM); different letters indicate p < 0.05 in the posthoc analysis. ns: pd, pS, and pd×s, not significant. CO: control; CS: choline supplemented; D: diet; HF: high-fat diet; NF: normal-fat diet; S: supplementation.

