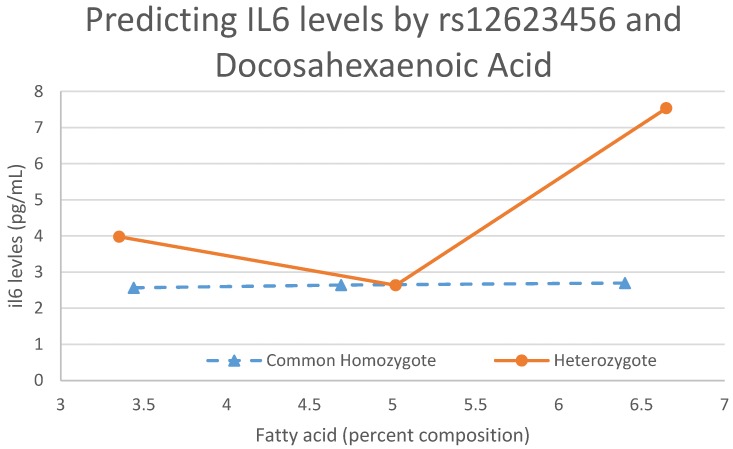
Figure 3.
An interaction plot between DHA and rs12623456 predicting IL6 levels. This figure shows the modulating effects the genotype has on FAs and the effect that interaction has on biomarker levels. The rare homozygote is not included in this plot because, in our sample, there are no individuals with that genotype.

