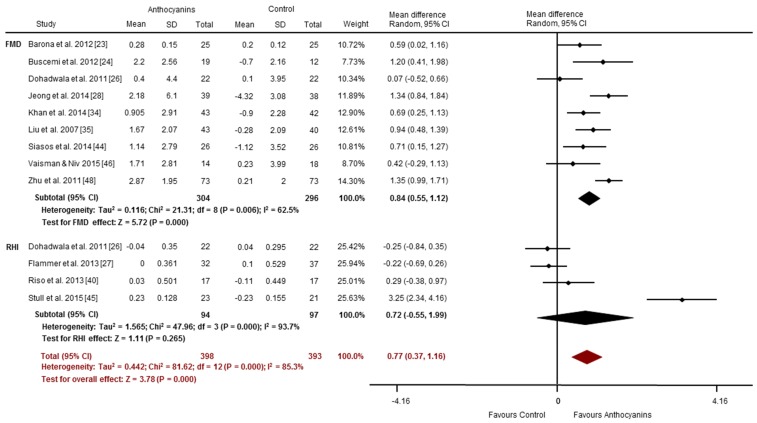
Figure 5.
Chronic effects of anthocyanins relative to control for vascular reactivity (assessed via FMD and RHI). The forest plot has one line representing each study in the meta-analysis, plotted according to the mean difference (indicated by the black diamond in each line). The horizontal line joins the lower and upper limits of the 95% CI of these effects. The black diamond at the bottom of each graph represents the average effect size for FMD and RHI studies. The red diamond represents the average effect size for all studies assessing vascular reactivity.

