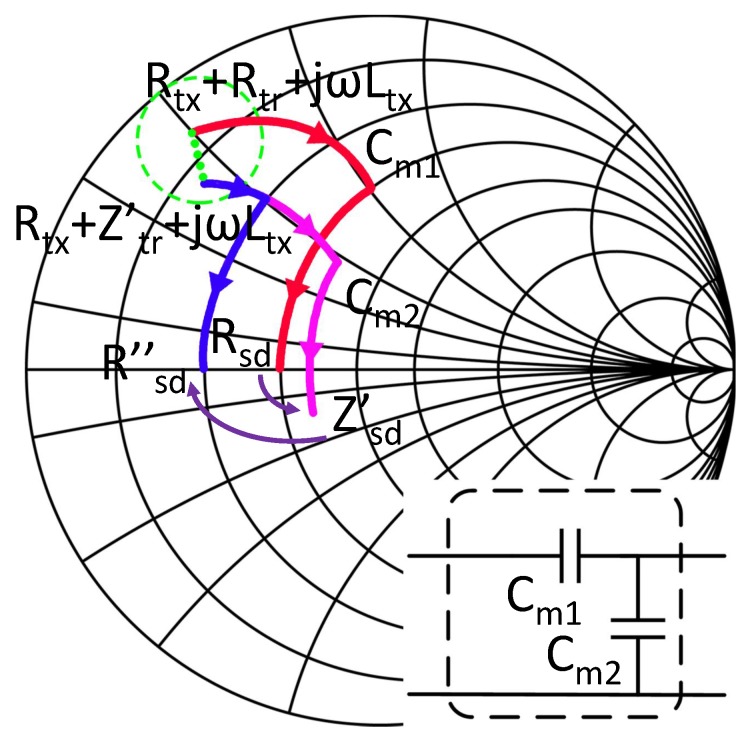
Figure 5.
The mismatch and rematch process shown in smith chart. The red curve is the original state of the SIMN; the pink curve is the mismatch state when the coupling or load is varied and the SIMN is not adjusted; the blue curve is the matching state when the SIMN is adjusted according to the variation.

