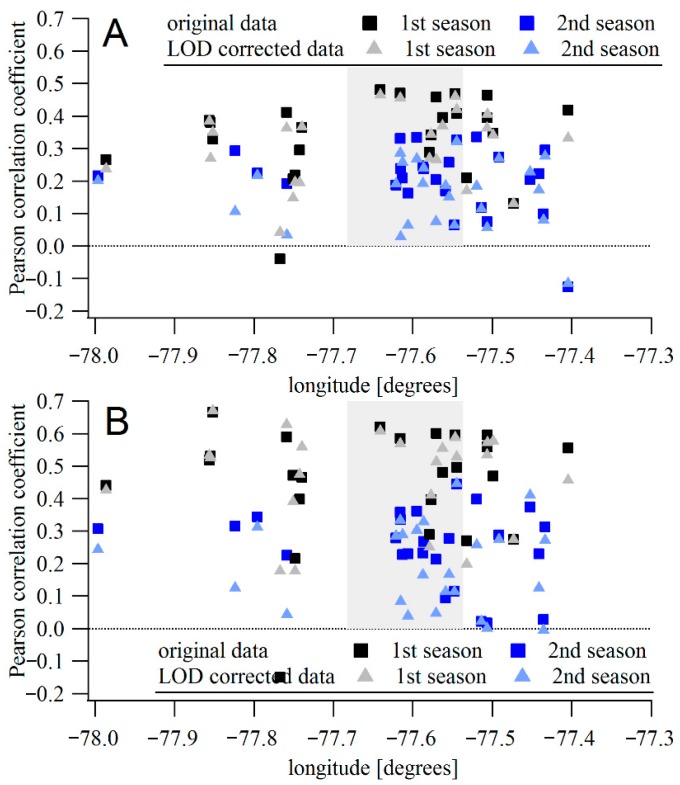
Figure 3.
(A) Pearson correlation coefficient between hourly averaged concentrations measured by Speck units and TEOM located at the Rochester DEC site, dependent on the longitude of the Speck location (DEC site at −77.55°). The gray area highlights the Rochester city center. (B) The same for daily averages.

