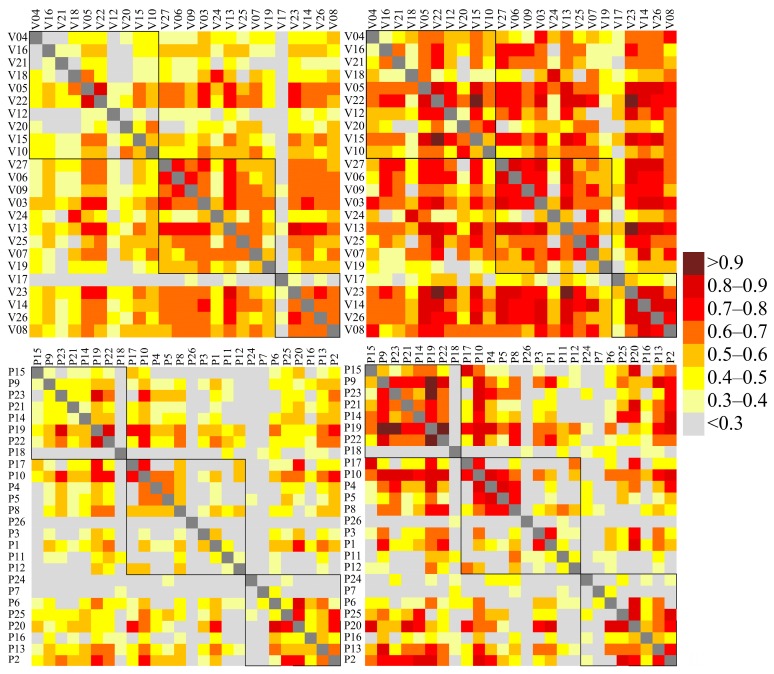
Figure 4.
Pearson correlation coefficient between Speck PM monitors calculated from hourly (left) and daily (right) PM averages, and from the 1st period (top) and 2nd period (bottom). LOD uncorrected data only were considered. The black squares denote groups of measurement sites geographically similar to each other.

