
Figure 2.
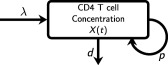
Schematic of the model. The compartment X(t) represents CD4 T‐cell concentration in the peripheral blood with time t after hematopoietic stem cell transplantation (HSCT). New cells output by the thymus enter the compartment at zero‐order rate λ and cells proliferate into two cells or die at first‐order rates p and d, respectively. Scaling for age was added to λ, p, and d and a function causing a time delay in the recovery of λ after transplant was used.