
Figure 4.
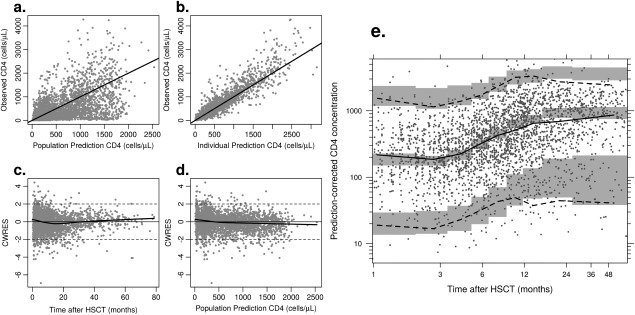
Diagnostic plots for the model. (a and b) give population and individual predictions vs. observations; (c and d) give conditional weighted residuals (CWRES) against time and population prediction, respectively; (e) gives a visual predictive check: dots give the observed data, the solid black line the observed median, and the dashed black lines the observed 95% prediction intervals. The gray shaded areas give the 95% confidence intervals for the predicted median and for the predicted 95% prediction intervals.