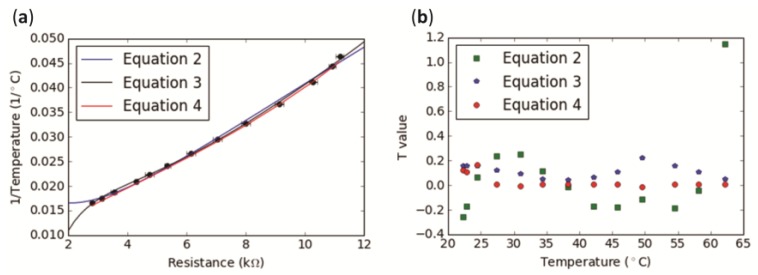
Figure 2.
Calibration showing readings from five electronic temperature-sensing yarns (ETS yarns). (a) The averaged values of the resistances of the five electronic temperature-sensing yarns have been plotted (black markers) against the reciprocal of the temperature. Two polynomial fittings were applied as well as the manufacturer’s equation to calculate the reciprocal of temperature; (b) Residuals for each of the Equations (2)–(4).

