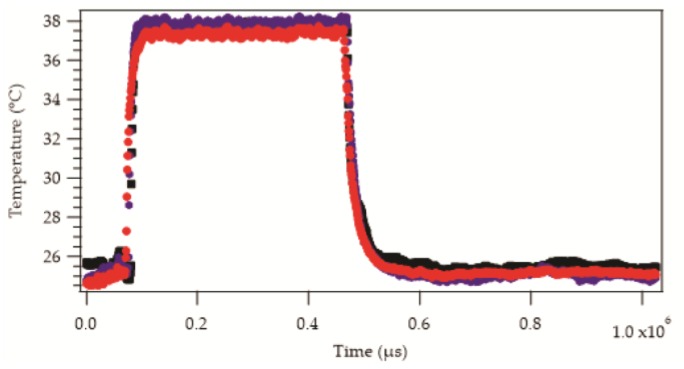
Figure 3.
Sample data set showing the temperature response of three different samples when placed onto the hotplate (38 °C) and then removed to room temperature (25 °C). The temperature reading for all of the samples increased to an equilibrium value exponentially. Similarly, cooling shows an exponential relationship. The diameters of the resin micro-pods are as follows:  = 0.70 mm,
  = 1.00 mm,
  = 1.90 mm. Markers appear as lines in the figure due to the density of data.

