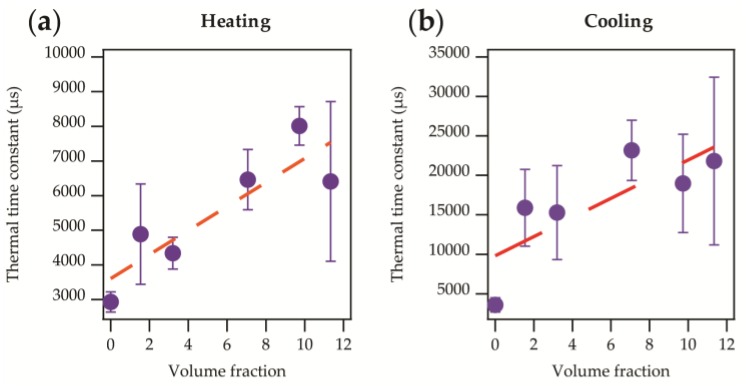
Figure 5.
Thermal time constant against the volume fraction of resin surrounding the thermistor compared to the thermistor’s volume. Data presented shows when samples were directly attached to the hotplate ( ; previously shown in Figure 4a). (a) Heating thermal time constant. A direct linear relationship (r2 = 0.776) is observed as shown in Equation (5); (b) Cooling thermal time constant. The linear relationship (r2 = 0.629) observed is shown in Equation (6).

