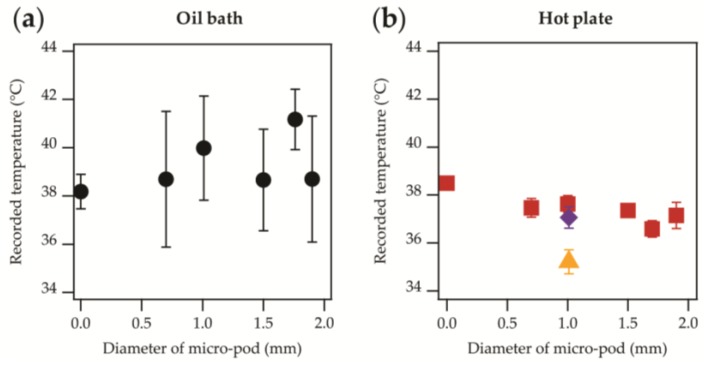
Figure 6.
Averaged temperature values once an equilibrium was reached for samples with micro-pod diameters from 0 mm (unencapsulated) to 1.90 mm. (a) Data presented shows experiments where an oil bath was used ( ); (b) The samples were attached directly to a hotplate (
 ). Data from samples that have included covering fibres; temperature-sensing yarn (
 ), temperature-sensing yarn with an additional fibrous sheath (
 ).
).

