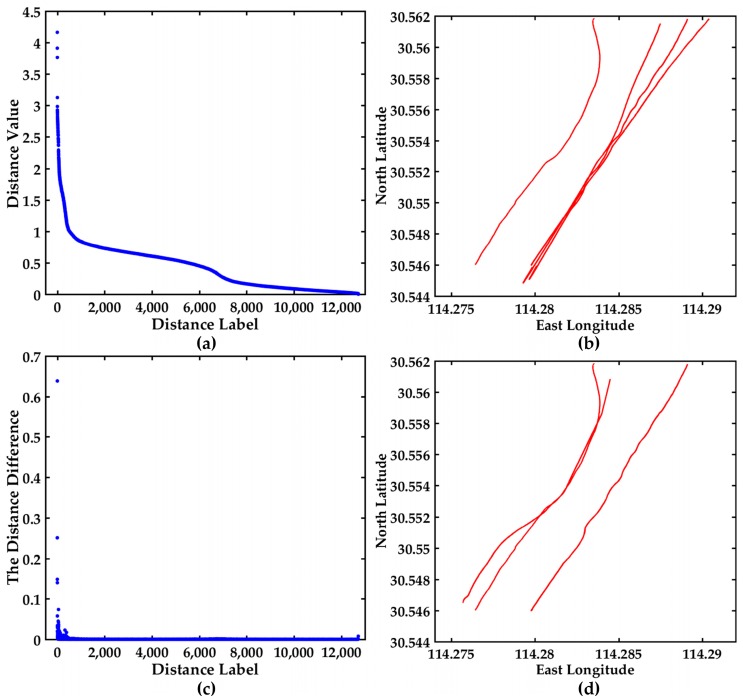
Figure 7.
Visualization of the distance values between 161 trajectories and the corresponding trajectories, (a) The descending order map of distance values; (b) The trajectories display corresponding to the top three distances; (c) The distance difference display between two adjacent distance values in (a); (d) The trajectories display corresponding to the maximum distance difference.

