Fig. (5).

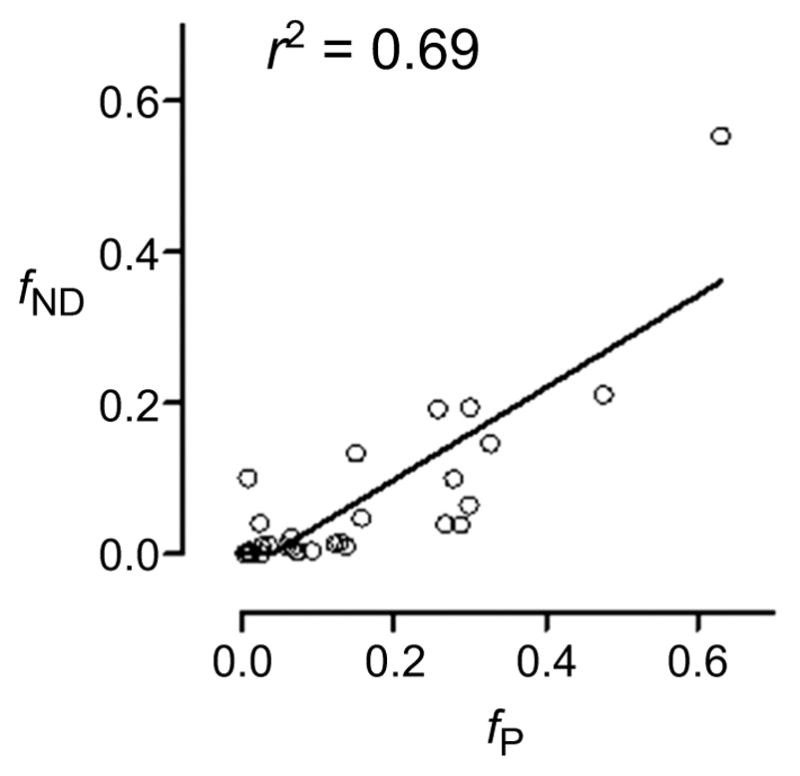
Plot of fND versus fP for 28 ligands in pig. Data are sourced from from Guo et al. [99]. Although the plot shows a quite strong linear correlation, slope is far from unity, and differences between parameters can be large for many ligands.

Plot of fND versus fP for 28 ligands in pig. Data are sourced from from Guo et al. [99]. Although the plot shows a quite strong linear correlation, slope is far from unity, and differences between parameters can be large for many ligands.