
Fig. 3.
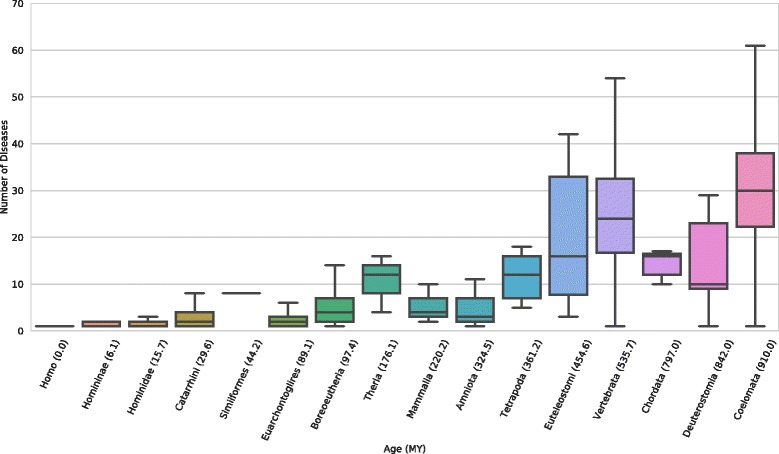
The number of diseases associated with a miRNA significantly increases with its age. Each box and whisker plot gives the median, upper and lower quartiles, and 1.5 times the inner-quartile range of the number of diseases associated with miRNAs of each age. The Spearman’s correlation between miRNA age and the number of diseases is 0.78 (P = 7.4e–103)