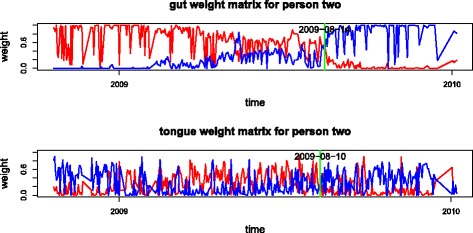
Fig. 6.

Gut and tongue weight matrix time series plot for person two. The top plot shows the gut weight matrix on the second type (red line) and third type (blue line) from NMF with 3 types. The bottom plot shows the tongue weights on the first type (red line) and the third type (blue line) from NMF for tongue data with 4 types
