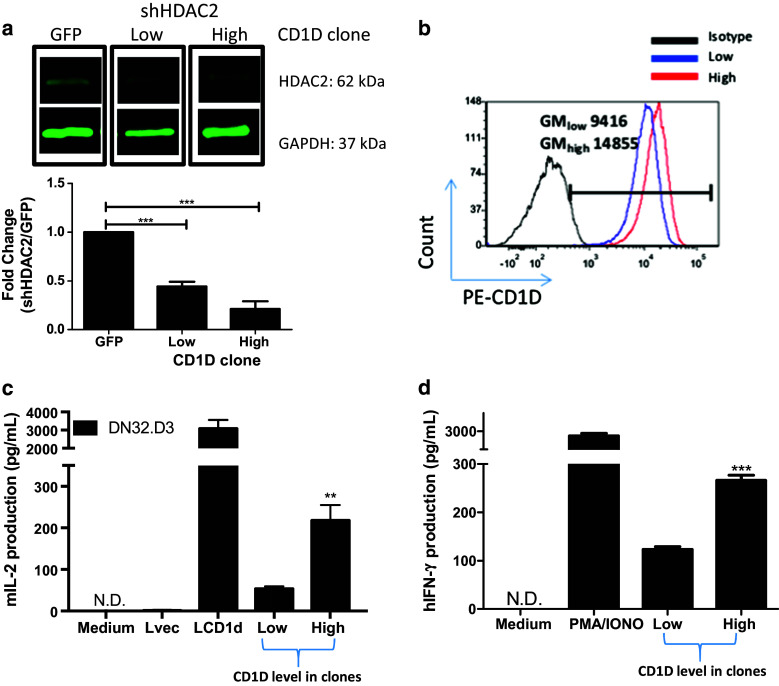
Fig. 4.
Dose dependence of CD1d levels and NKT cell activation. a HDAC2 knockdown was confirmed in JeKo-1 displaying low and high CD1d levels. Bottom panel shows fold change in HDAC2 levels in shHDAC2 knockdown-containing JeKo-1 cells relative to GFP control JeKo-1 cells. Values were normalized to GAPDH b shHDAC2 clones displaying low (blue histogram) and high (red histogram) levels of cell surface CD1d. The GM values are shown for low and high CD1d clones. c Antigen presentation capabilities of low and high CD1d level expressing shHDAC2 clones were assessed in a co-culture with NKT cell hybridomas. d Similar experiment was performed with primary human NKT cells, and IFN-γ production was assessed by ELISA. *p < 0.05, **p < 0.005, and ***p < 0.0001

