
Fig. 6.
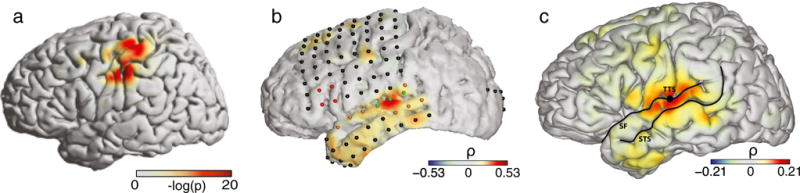
Examples of plots produced using NeuralAct. a Activations rendered on the default model of the cortical surface in a single subject. Extracted from Fig. 6 in Kubanek et al. (2009), with permission. b Activations on a subject-specific cortical surface. Extracted from Fig. 5C in Kubanek et al. (2013). c Subject-average activations. In this case, NeuralAct computed activation average over 5 subjects. Extracted from Fig. 5AVG in Kubanek et al. (2013)