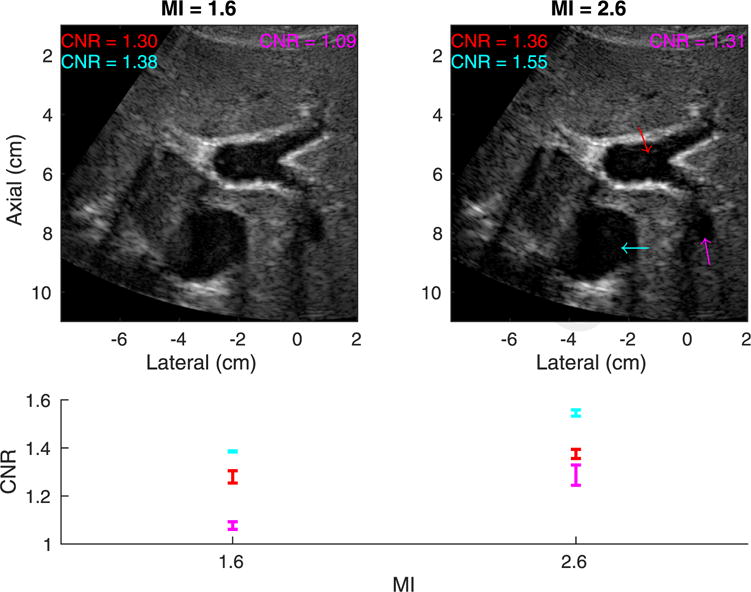
Fig. 2.

Top: Matched tissue harmonic images using mechanical index (MI) values of 1.6 (left) and 2.6 (right) in an easy-to-image (category 1) volunteer with a body mass index of 20.9 kg/m2. The arrows indicate structures in which the contrast-to-noise ratio (CNR) was computed. Both images are shown with a dynamic range of 60 dB. Bottom: CNR versus MI for each structure. The error bars reflect the variability of CNR among the three pairs of measurements at each MI.
