
Fig. 9.
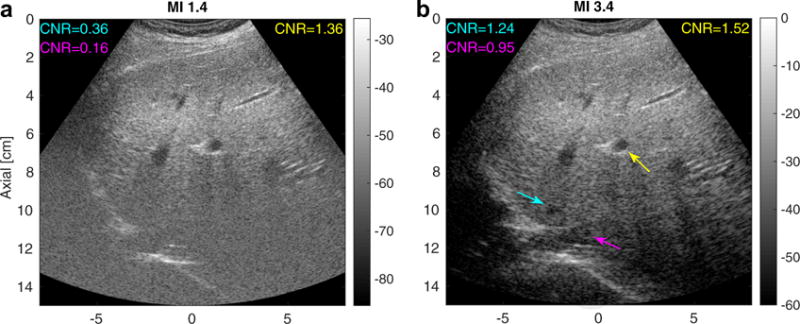
Matched tissue harmonic images using a typical mechanical index (MI) value (MI = 1.4, left) and an elevated MI value (MI = 3.4, right) focusing at 5 cm in an obese volunteer (BMI = 30.4 kg/m2) with a fatty liver. The image intensities are in decibels. The arrows point to vessels in which the contrast-to-noise ratio (CNR) was computed. The cyan and magenta arrows in the right image indicate structures deep to the focus that are visible only in the elevated-MI configuration.