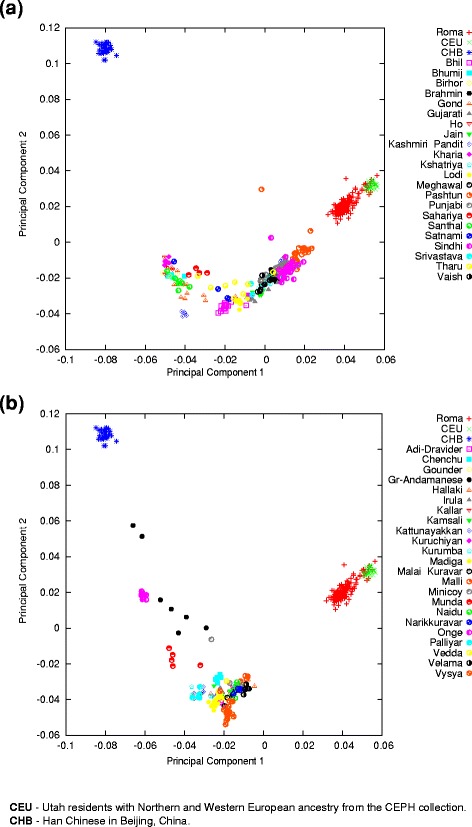
Fig. 2.

Relationship of Roma to European and South Asian Populations. The principal component analysis results were plotted on the two principal components with the highest eigenvalue. One symbol represents one individual. a Relationship of Roma to European and North Indian groups. b Relationship of Roma to European and South Indian groups. Separating North and South Indian populations have only practical purpose in order to give a better overview. Both graphs are the result of the same PCA
