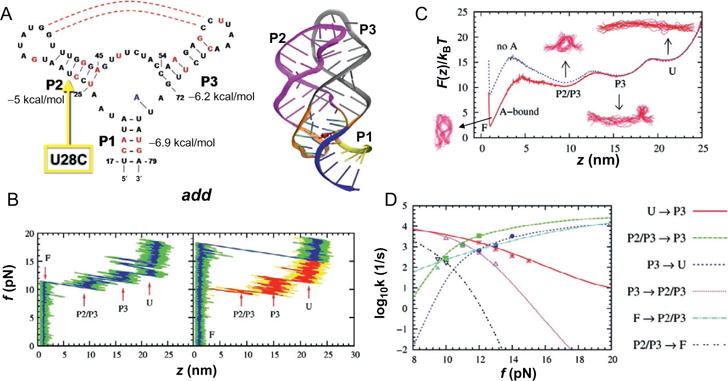
Figure 3.

Force-induced dynamics of add A-riboswitch (RS). (A) Structure of the conserved domain of purine riboswitch containg a three way junction. On the left is the secondary structure map and on the right the three dimensional structure is shown. (B) Force-extension curves (FECs) obtained by pulling the RS at loading rate of 960 pN/s in the presence (left) and absence (right) of metabolite. The FEC in red on the right panel was obtained during the refolding of the RS while the exerted force is reduced. (C) Free energy profile F(z) with (red) and without (blue) the metabolite. (D) Force-dependent transition rates. The data points are directly from simulation; the lines were obtained by calculating mean first passage time using F(z) with a force-independent diffusion constant, which was calibrated by equating the theoretical and simulation rates. Figure adapted from J. Lin and Thirumalai (2008).
