
Figure 5.
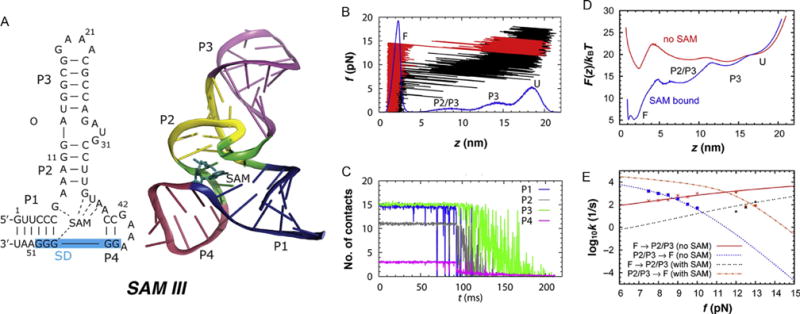
Dynamics of SAM-III riboswitch under force. (A) Structure of SAM-III RS. The blue shaded area on the left indicates the Shine–Dalgarno sequence recognized by the ribosome. (B) Simulated force-extension curve of SAM-III riboswitch in the absence of metabolite (black) produced at rf = 96 pN/s. The distribution of molecular extension (z) during the pulling simulation is shown in blue at the bottom. FEC in red was produced in the presence of metabolite at the binding pocket. (C) Average number of contacts in each helix from P1 to P4. (D) Free energy profile at zero force calculated from streching simulation with and without metabolite (SAM) in the binding pocket. (E) Transition rates between F and P2/P3 states at varying forces. The data points are from explicit simulations. The lines were obtained from mean first passage time calculation on F(z). Figure adapted from J.-C. Lin and Thirumalai (2013).