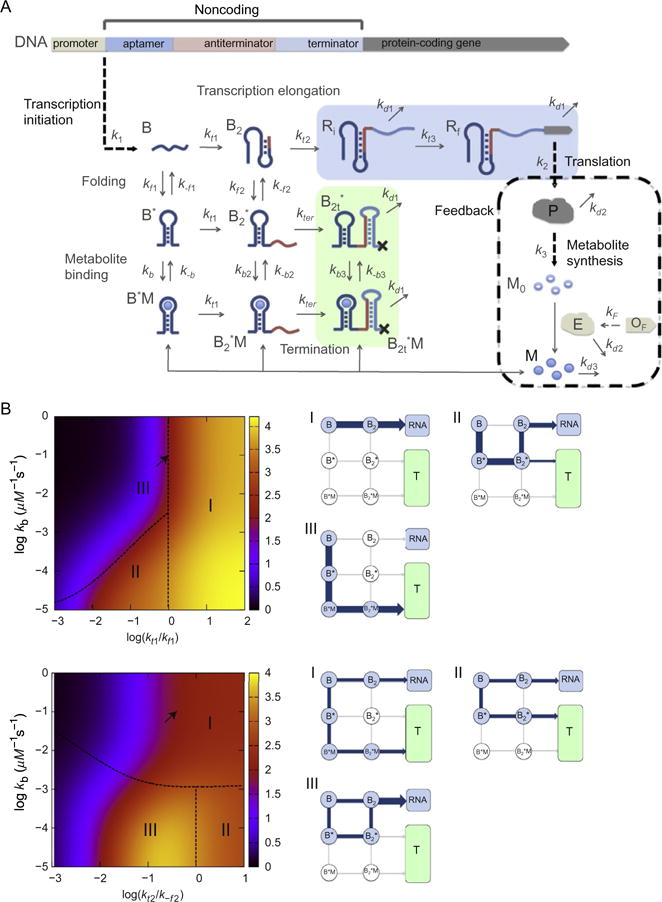
Figure 6.

(A) Kinetic network model for transcription regulated by “OFF”-riboswitches. (B) Dependence of protein production on the network parameters with “negative feedback” (kf1 = 0.1 s−1, k−f1 = 0.04 s−1, kf2 = 2.5 × 10⁻³ s−1, k−f2 = 0.04 s−1, kt1 = 0.1 s−1, kt2 = 0.016 s−1, kb = 0.1 μM−1 s−1, k−b = 10−3 s−1, kt3 = 0.01 s−1, K1 = 0.016, k2 = 0.3 s−1, k3 = 0.064 s−1, kd1 = 2.3 × 10⁻³ s−1, kd2 = 2.7 × 10⁻⁴s−1, kd3 = 4.5 × 10⁻³s−1, and μ = 5 × 10⁻⁴s−1. (Top) Protein levels [P] (color (different gray shades in the print version) coded) as functions of kt1/kf1 and kb). The dependence of [P] on kt1 and kb is categorized into three regimes. Points on the dashed line separating regime II and regime III satisfy kb[M] = kt1. The major pathway in the transcription process in each regime is shown on the right. The arrow indicates the data point from the value of kt1 = 0.1 s−1 and kb = 0.1 s−1. (Bottom) [P] as functions of kt2/kf2 and kb. Points on the dashed line separating regime I and M/MI satisfy kb1[M] = k−f2. The data point corresponding to the arrow results from using the value of kt2 = 0.016 s−1 and kb = 0.1 s−1. Figure adapted from J.-C. Lin and Thirumalai (2012).
