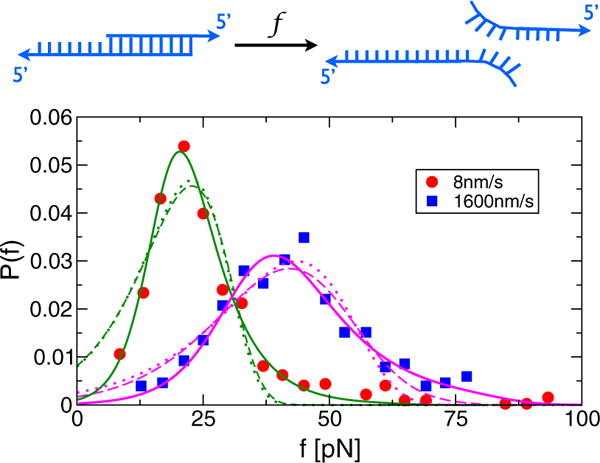
FIG. 2.

(color online). Analysis of rupture force distributions from a DNA unzipping force spectroscopy experiment (the AFM cantilever spring constant ≈2 pN/nm) [17] using three different models. The fits using (solid lines), based on our FB model, yield (Δx‡[nm], k0θ[s−1],λ[s−1]) = (1.1;0.017;2.8×10⁻⁵) for v = 8 nm/s and (0.66, 0.99, 0.48) for v = 1600 nm/s. The fits using Pcubic [ε(f)] = (k(ε)/γ) exp [(k0/γΔ x‡) × (1 − (k(ε)/k0)ε−1=2)] (dashed lines) with and ε(f) = 1–2f Δx‡/3ΔG‡ [23] yield (Δ x‡[nm]; k0[s−1]; ΔG‡[pN·nm]) = (0.12;0.12;31.9) for v = 8 nm/s and (0.09,7.16,19.0) for v = 1600 nm/s. The fits using (dotted lines) yield (Δx‡ [nm]; k0[s−1]) = (0.49; 0.13) for v = 8 nm=s and (0.32, 8.19) for v = 1600 nm=s. Note that Pλ(f) describes the heavy tails of the distributions better than Pcubic(f) or PBell(f), implying that unbinding of these DNA duplexes by force cannot be accounted for using one-dimensional models.
