Figure 6.
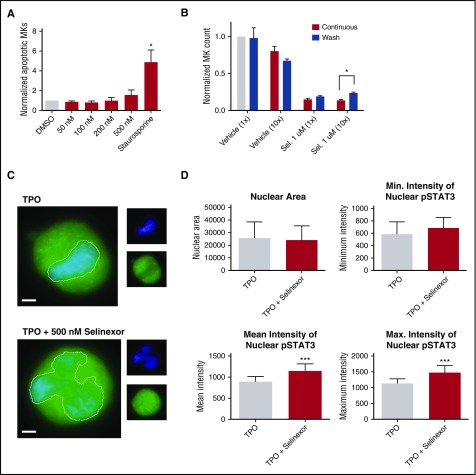
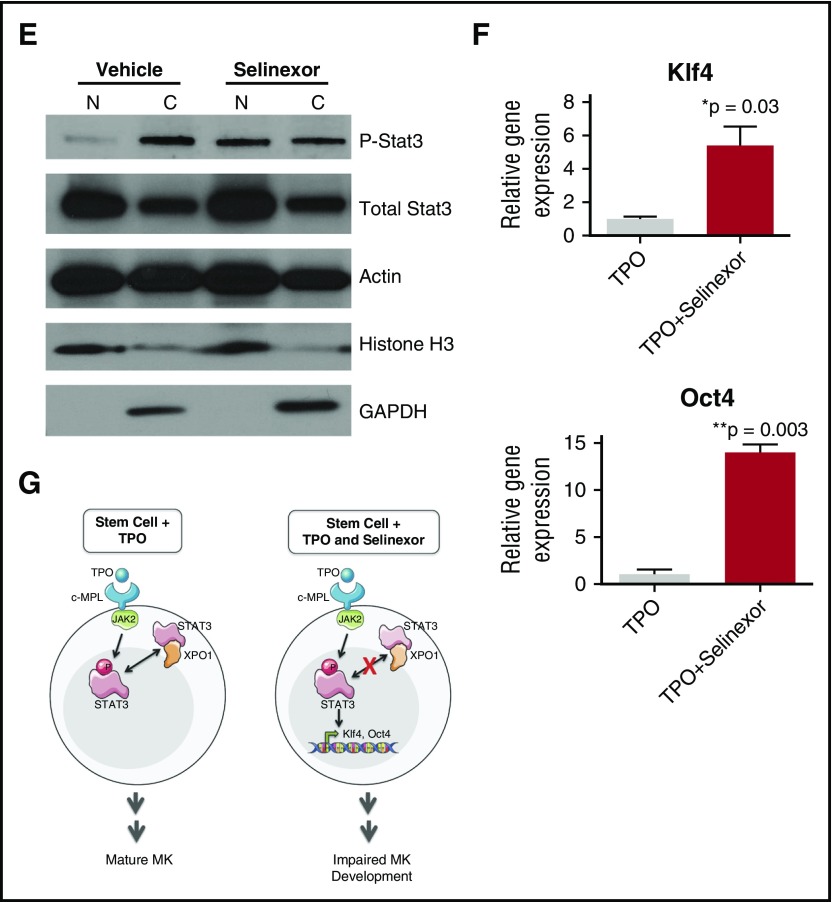
Selinexor treatment inhibits TPO signaling in vitro. D1 cells derived from murine fetal livers were incubated with selinexor at indicated doses. (A) Apoptosis was measured by annexin V positivity in all cells by FACS on D4; n = 4. (B) TPO was added at 1× (70 ng/mL) or 10× on D1. In addition, selinexor was added at indicated doses and was either washed out after 6 hours or kept in culture continuously. MK number on D4 was quantified by FACS. Values were normalized to 1× TPO control for each biological replicate, and then replicates averaged; n = 3. (C) Immunofluorescence of pSTAT3 was visualized in MKs treated with 500 nM selinexor or vehicle control. pSTAT3 is shown in green, and nuclear staining (Hoechst) is shown in blue. Bars represent 10 μm. To quantify nuclear fluorescence, the nuclear area was determined by thresholding in ImageJ (white outline), and the nuclear area and average, minimum, and maximum fluorescent intensities of pSTAT3 staining in the nucleus (as gated by Hoechst) were quantified in ImageJ (D). n = 12 cells per group; 3 biological replicates; ***P < .001. (E) MKs were serum starved in TPO-free media and treated with 500 nM selinexor or vehicle control for 6 hours. TPO was then added for 15 minutes to probe TPO signaling, and then MKs were separated into nuclear (N) and cytoplasmic (C) fractions. Fractions were probed for STAT3 and pSTAT3. The loading controls were as follows: actin (total protein), histone H3 (nuclear protein), and GAPDH (cytoplasmic protein). (F) Positive selection of CD41+ cells was performed on D1 of maturation to isolate a population of predominantly MK progenitors. After selection, the cells were treated with TPO or TPO and selinexor. On D4, quantitative polymerase chain reaction was performed as described to measure the levels of Klf4 and Oct4. (G) Schematic of proposed mechanism.


