
Fig. 4.
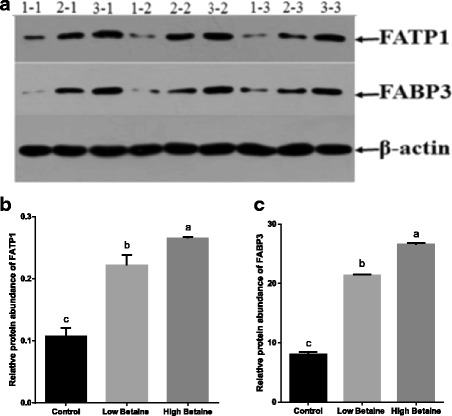
The relative protein abundance of FATP1 and FABP3 in muscle. Western blot results were shown in a (The control group: 1–1, 1–2, 1–3; Low betaine group: 2–1, 2–2, 2–3; High betaine group: 3–1, 3–2, 3–3). Data were normalized with β-actin as shown in b, c. a,bValues without common superscript letters differ significantly (P < 0.05). Low betaine and high betaine represent 1250 mg/kg and 2500 mg/kg betaine addition, respectively