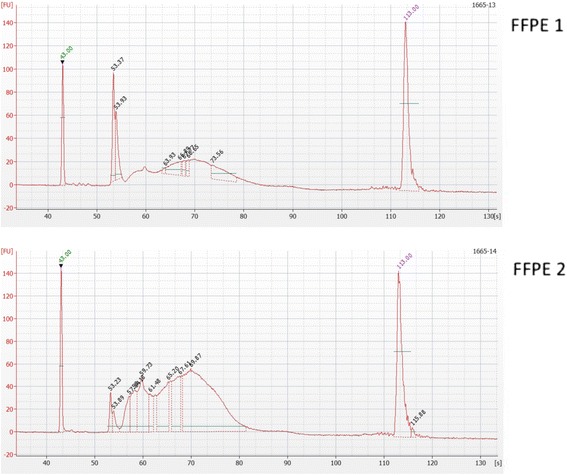
Fig. 3.

Bioanalyser images demonstrating quality of two FFPE RRBS libraries. Each of the RRBS libraries (FFPE1 and FFPE2) was run on an Agilent 2100 Bioanalyzer using the high sensitivity DNA kit. The electropherogram displays a plot of fragment size (bp) versus fluorescence intensity. Peaks at 35 bp and 10,380 bp represent lower and upper markers. The 160–340 bp peaks represent the RRBS library
