
Fig. 5.
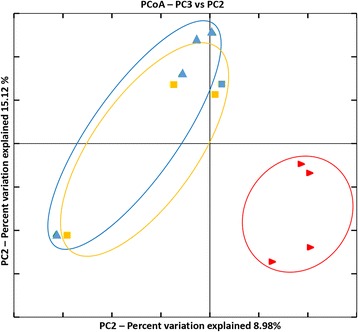
Beta diversity metrics of bacterial 16S rRNA genes among the seeds microbiomes of three investigated oilseed rape cultivars. Beta diversity community clustering is observed for phylogenetic beta diversity metrics (weighted UniFrac). In the panel, each point corresponds to a sample from either Avatar (red triangles), Traviata (orange squares) or Sherpa (blue triangles) seed samples. The percentage of variation explained by the plotted principal coordinates is indicated on the axes